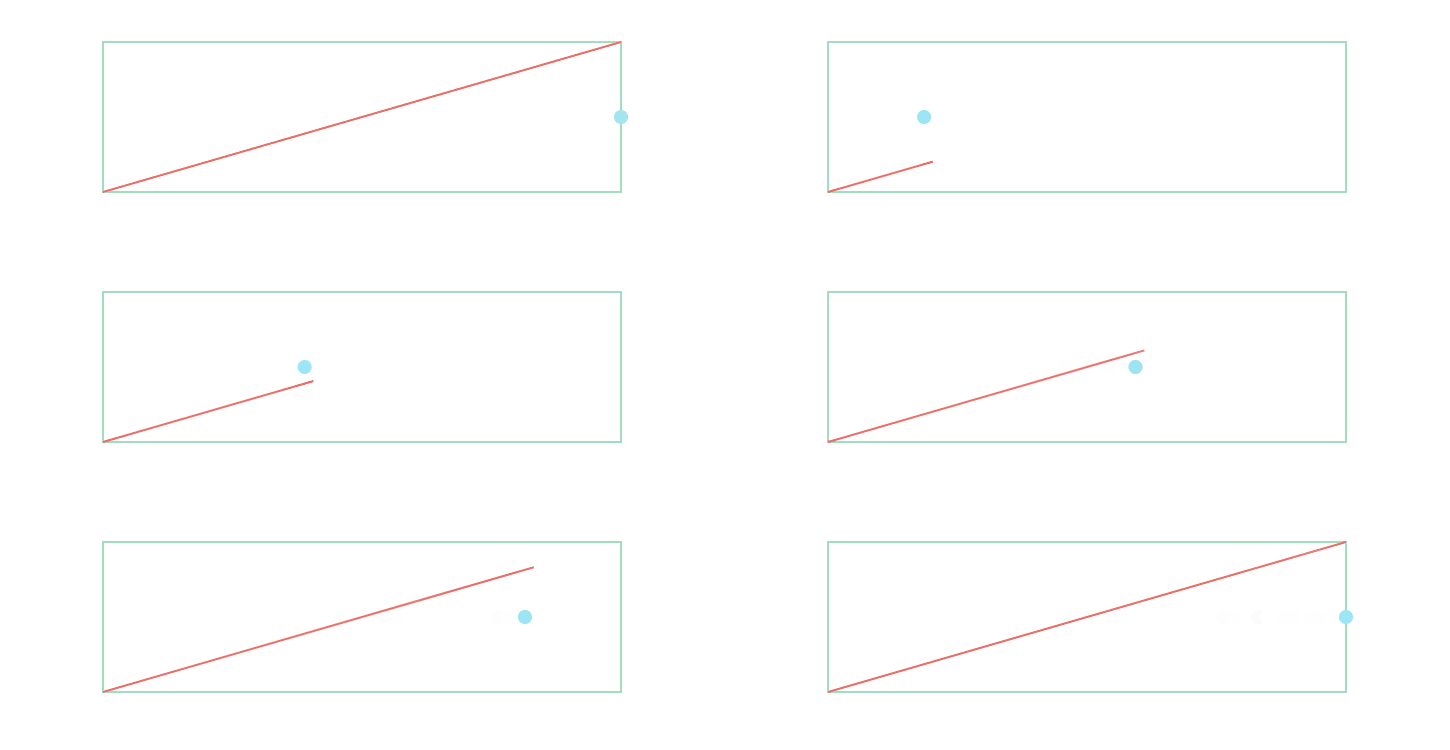
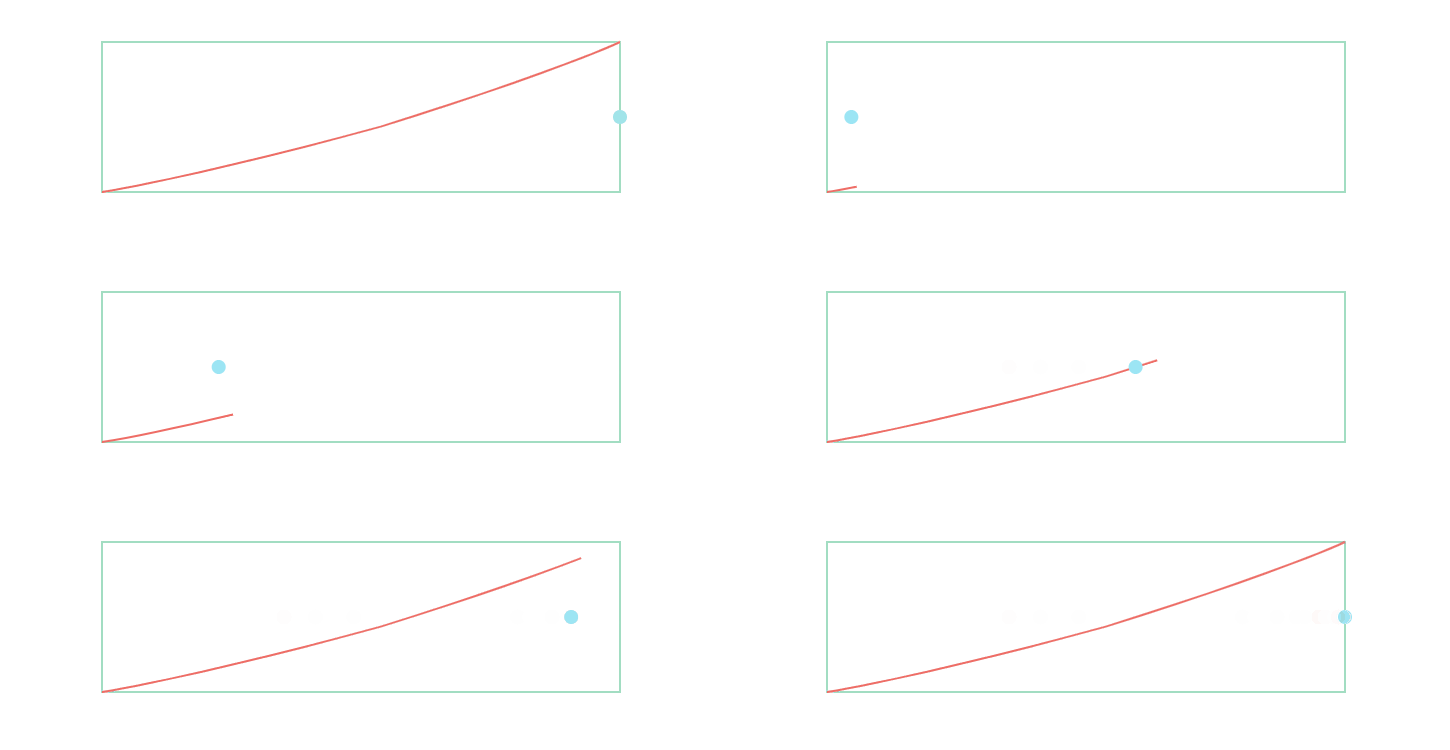
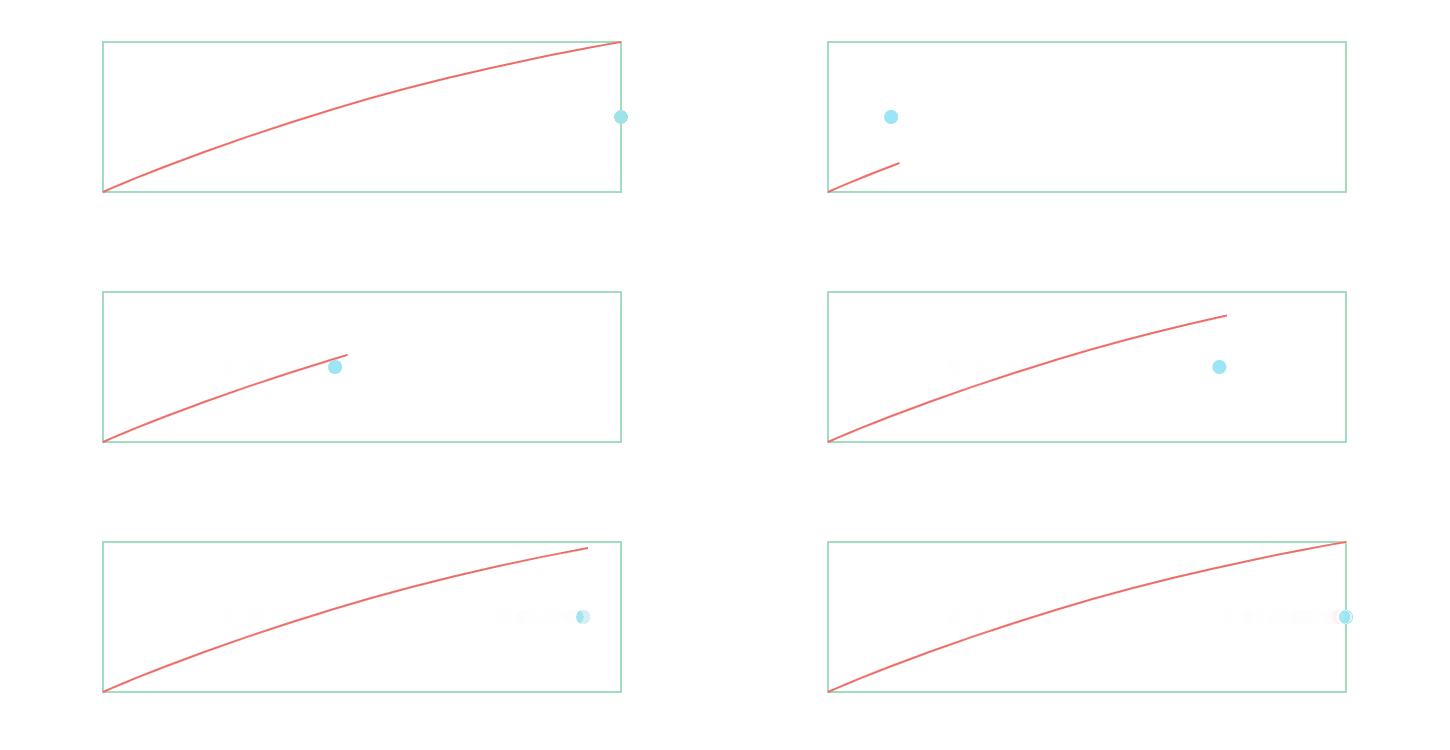
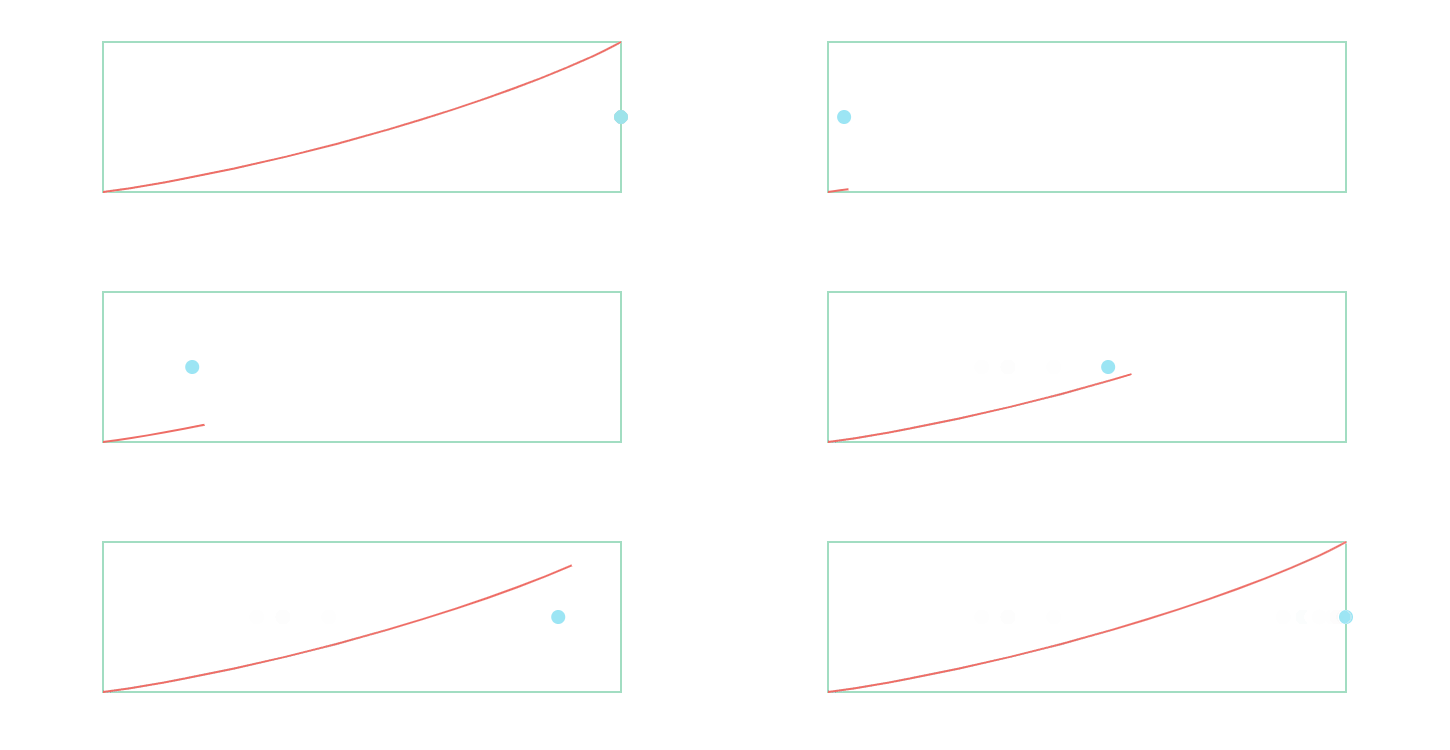
You cannot select more than 25 topics
Topics must start with a letter or number, can include dashes ('-') and can be up to 35 characters long.
|
|
4 months ago | |
|---|---|---|
| .. | ||
| build | 4 months ago | |
| deploy | 4 months ago | |
| dist | 4 months ago | |
| exampleImg | 4 months ago | |
| lib | 4 months ago | |
| src | 4 months ago | |
| test | 4 months ago | |
| .babelrc | 4 months ago | |
| .travis.yml | 4 months ago | |
| CHANGELOG.md | 4 months ago | |
| LICENSE | 4 months ago | |
| README.md | 4 months ago | |
| README_EN.md | 4 months ago | |
| package.json | 4 months ago | |
README_EN.md
Transition
What is Transition?
- It is a dynamic effect plugin based on Bezier Curve.
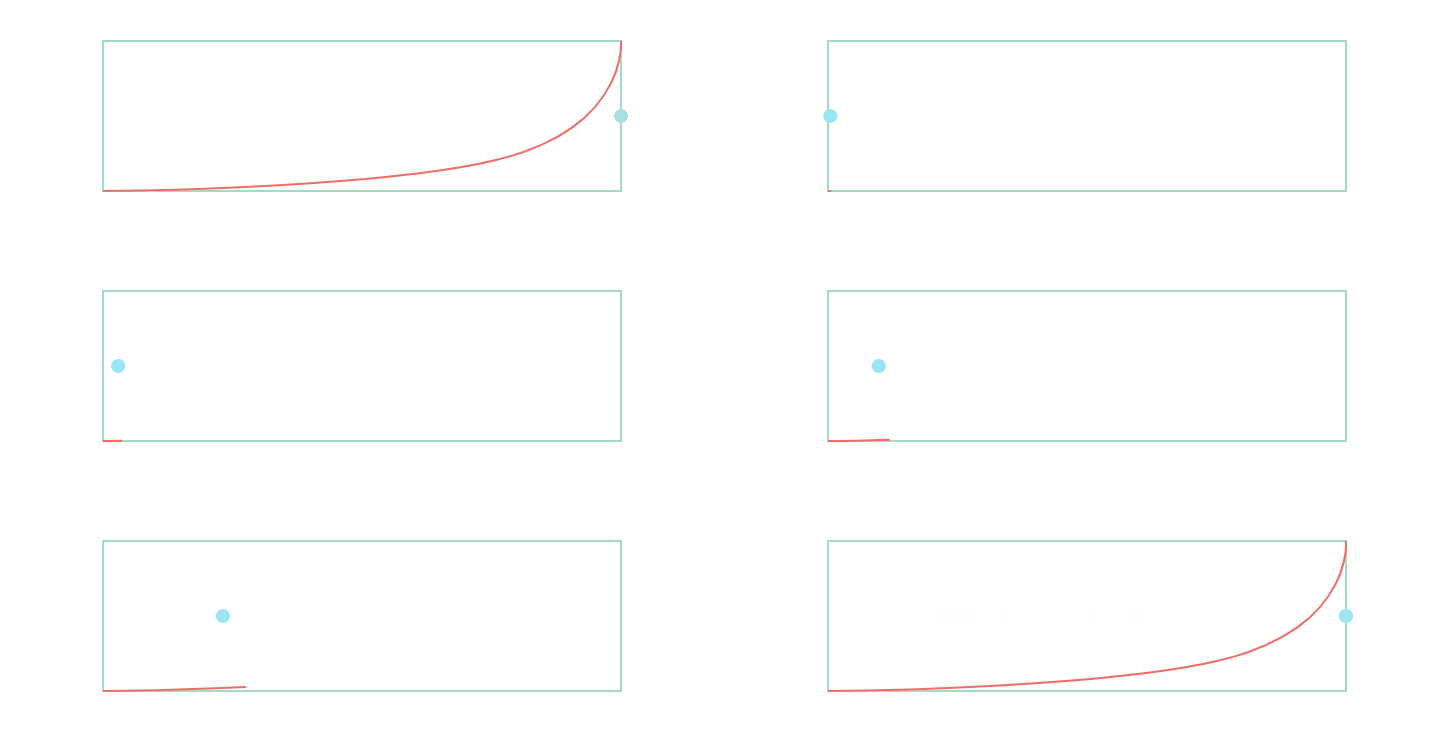
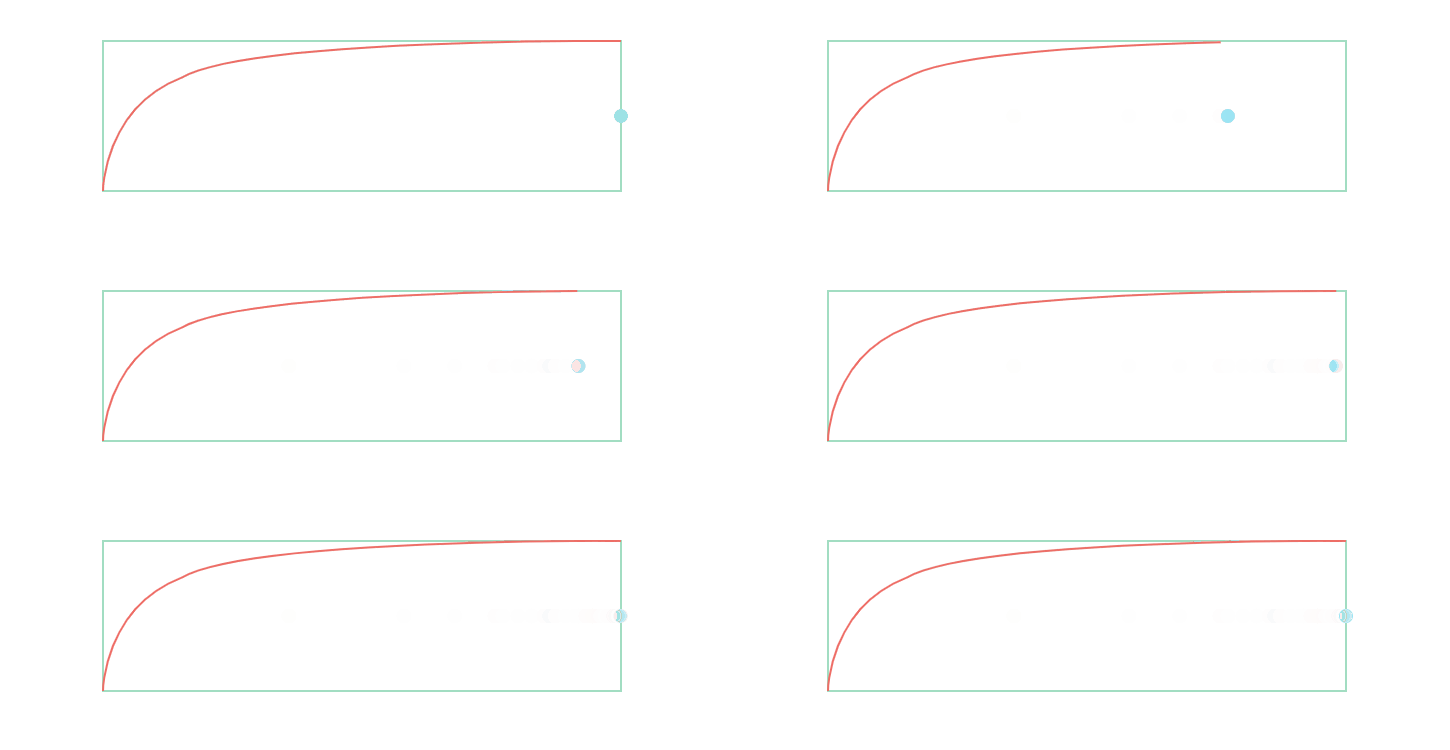
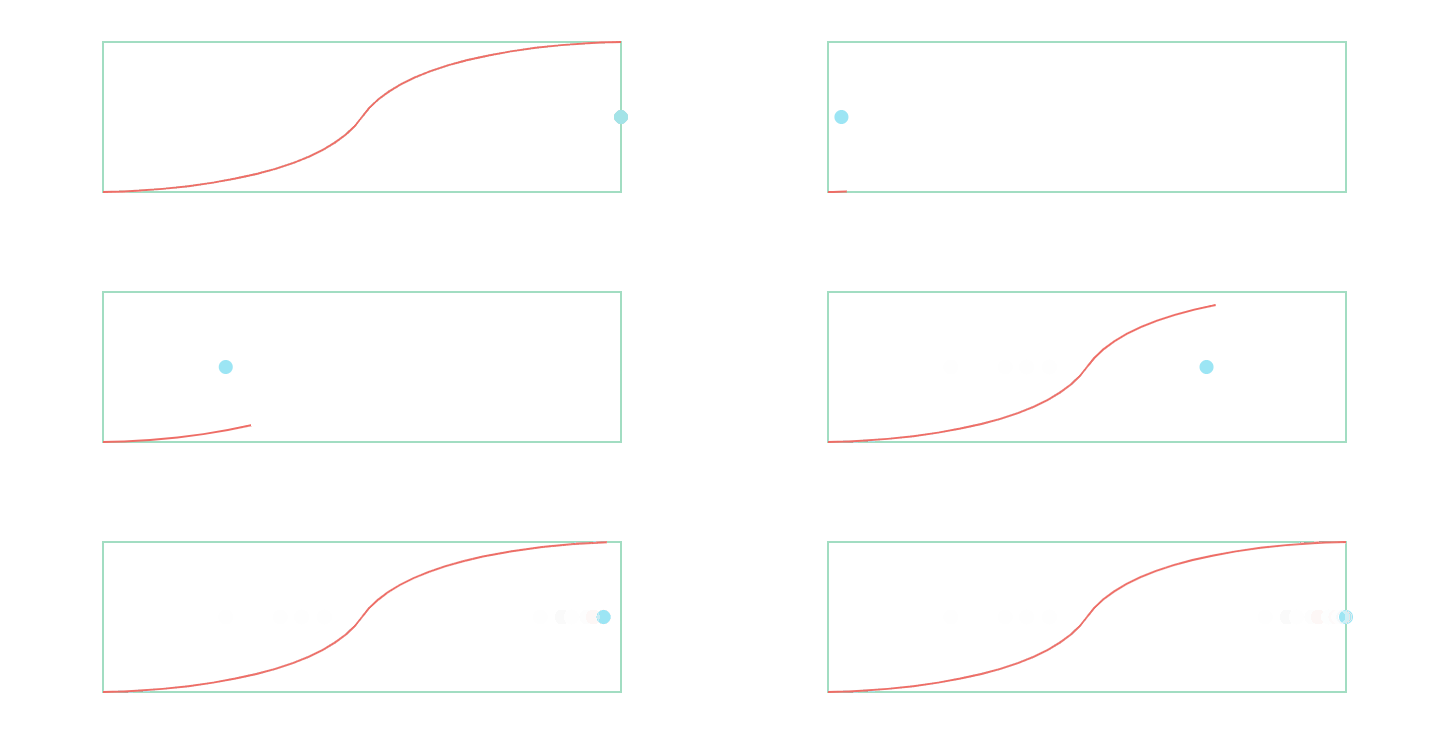
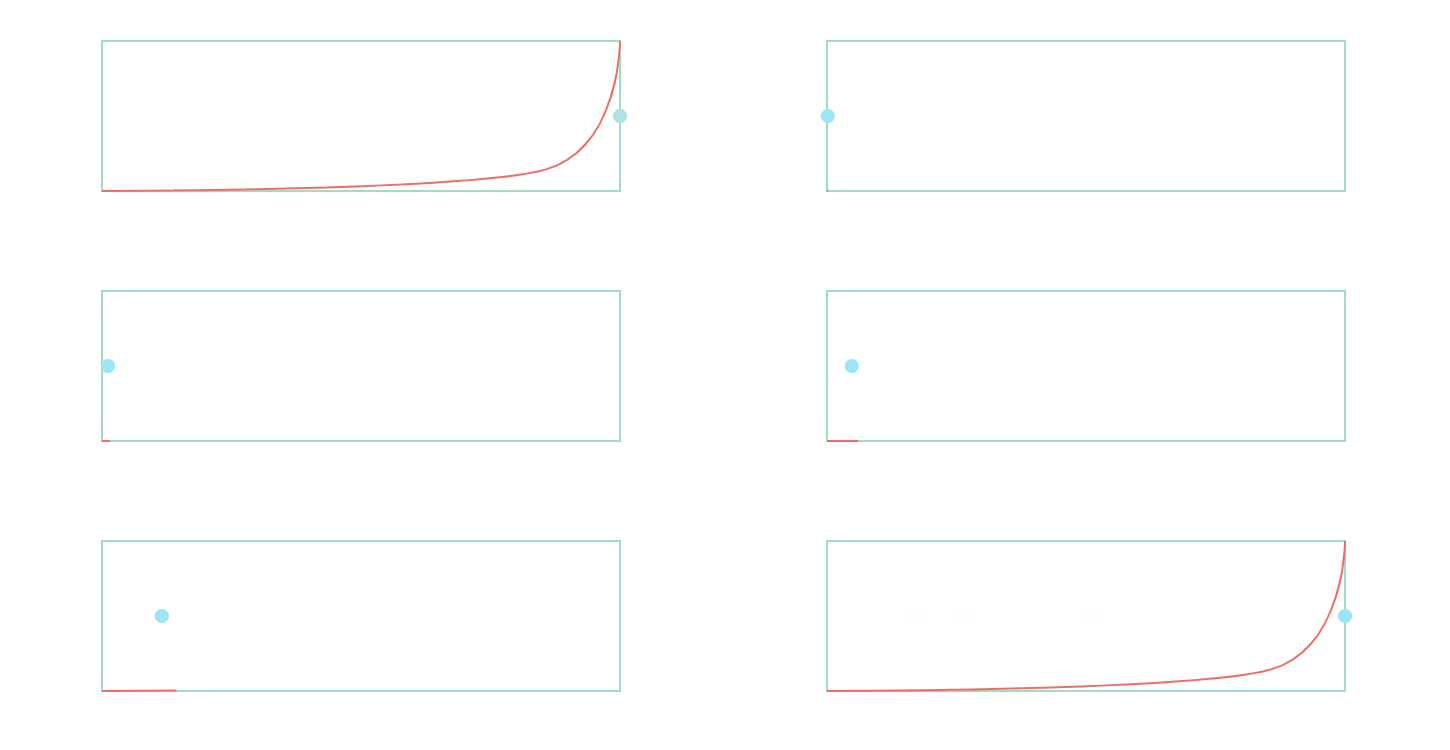
- It provides common easing curve.
- Customizable easing curve.
How is the animation produced?
- Get one frame data of the animation.
- Draw this frame animation.
- Repeat...
We can use three sets of data to describe an animation (animation start state, animation end state, easing curve).Based on these three sets of data, we can calculate the state of each frame of the animation,this is what Transition provided.According to the data of each frame, we carry out continuous redrawing, and the animation is generated.
Install with npm
$ npm install @jiaminghi/transition
Use
import { transition, injectNewCurve } from '@jiaminghi/transition'

// do something
Quick experience
<!--Resources are located on personal servers for experience and testing only, do not use in production environments-->
<!--Debug version-->
<script src="http://lib.jiaminghi.com/transition/transition.map.js"></script>
<!--Compression version-->
<script src="http://lib.jiaminghi.com/transition/transition.min.js"></script>
<script>
  const { transition, injectNewCurve } = window.transition
  // do something
</script>
Detailed documents and examples can be viewed on the HomePage.
Annotation
/**
 * @description Get the N-frame animation state by the start and end state
 *              of the animation and the easing curve
 * @param {String|Array} tBC               Easing curve name or data
 * @param {Number|Arrya|Object} startState Animation start state
 * @param {Number|Arrya|Object} endState   Animation end state
 * @param {Number} frameNum                Number of Animation frames
 * @param {Boolean} deep                   Whether to use recursive mode
 * @return {Array} State of each frame of the animation
 */
function transition (tBC, startState = false, endState = false, frameNum = 30, deep = false) {  // ...
}
Examples
Transition provides three data types to describe the animation state.
Number
import transition from '@jiaminghi/transition'

const beginState = 0
const endState = 100

const animationState = transition('linear', beginState, endState, 10)

/**
 * animationState = [
 *   0, 11.03429355281208, 22.126200274348417, 33.259259259259245, 44.41700960219478,
 *   55.58299039780521, 66.74074074074073, 77.87379972565157, 88.96570644718793, 100
 * ]
 * /
Array
import transition from '@jiaminghi/transition'

const beginState = [10, 20, 30]
const endState = [100, 200, 300]

const animationState = transition('linear', beginState, endState, 10)

/**
 * animationState = [
 *   [10, 20, 30],
 *   [32.415625, 64.83125, 97.24687499999999],
 *   [55, 110, 165],
 *   [77.58437500000001, 155.16875000000002, 232.753125],
 *   [100, 200, 300]
 * ]
 * /
Object
import transition from '@jiaminghi/transition'

const objectBeginState = { x: 10, y: 10, r: 5}
const objectEndState = { x: 100, y: 10, r: 5}

const animationState = transition('linear', objectBeginState, objectEndState, 5)

/**
 * animationState = [
 *   {x: 10, y: 10, r: 5},
 *   {x: 32.415625, y: 10, r: 5},
 *   {x: 55, y: 10, r: 5},
 *   {x: 77.58437500000001, y: 10, r: 5},
 *   {x: 100, y: 10, r: 5}
 * ]
 * /
Recursive
Use recursive mode to calculate deep data in Array or Object.
import transition from '@jiaminghi/transition'

const beginState = {
  points: [ [10, 30], [20, 80] ],
  origin: { x: 10, y: 20 },
  radius: 3
}

const endState = {
  points: [ [100, 230], [120, 10] ],
  origin: { x: 100, y: 200 },
  radius: 9
}

const animationState = transition('linear', beginState, endState, 3, true)

/**
 * animationState = [
 *   {
 *     origin: { x: 10, y: 20 },
 *     points: [ [10, 30], [20, 80] ],
 *     radius: 3
 *   },
 *   {
 *     origin: { x: 55, y: 110 },
 *     points: [ [55, 130], [70, 45] ],
 *     radius: 6
 *   },
 *   {
 *     origin: { x: 100, y: 200 },
 *     points: [ [100, 230], [120, 10] ],
 *     radius: 9
 *   }
 * ]
 * /
Notice
- Non-Number attribute or element does not participate in calculations.
- The data type of the start and end state should be consistent(Including the number of attributes and elements).
Extend New Easing Curve
If you want to extend the new easing curve, you can use the injectNewCurve method provided by Transition to extend.
import { injectNewCurve } from '@jiaminghi/transition'

const curveName = 'linear'

// Can be obtained by drawing tools
const bezierCurve = [[[0, 1]],[[1, 0]]]

injectNewCurve(curveName, bezierCurve)
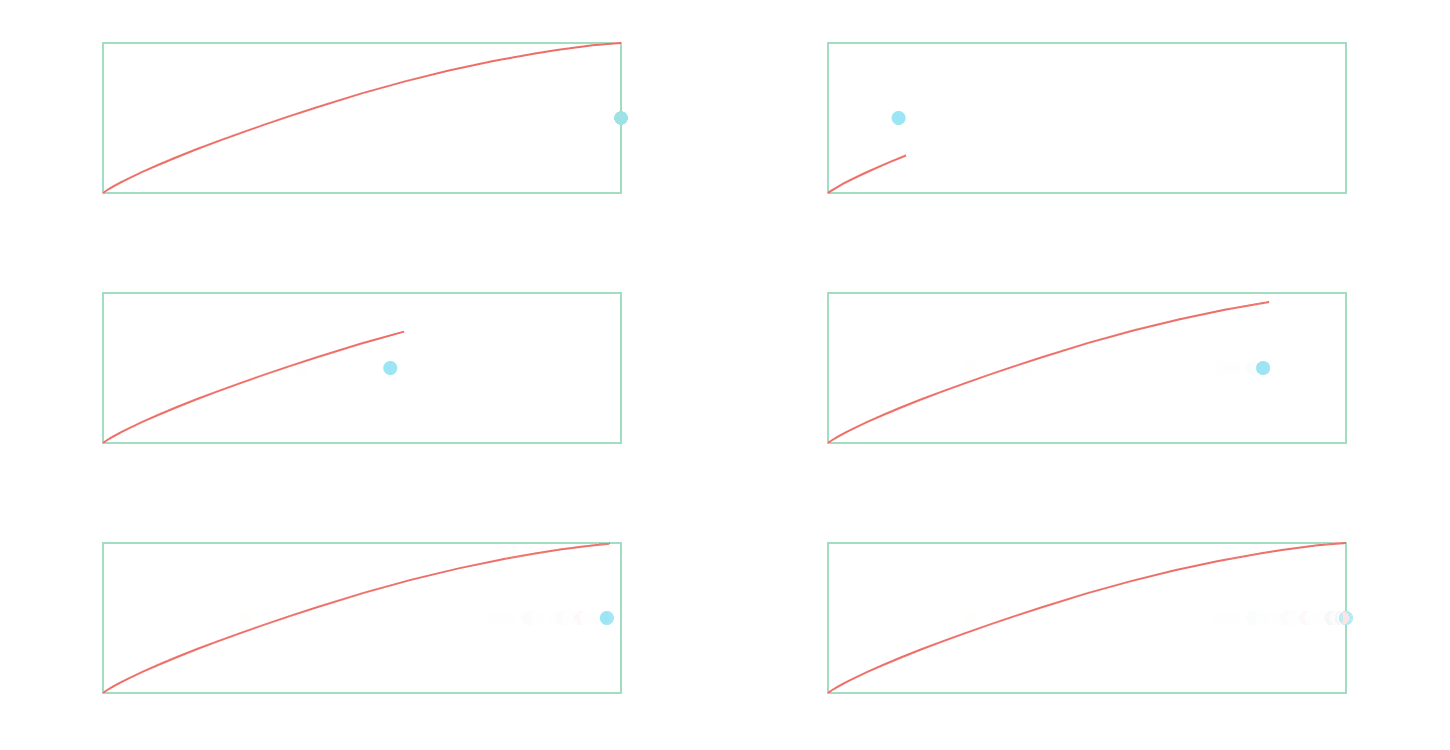
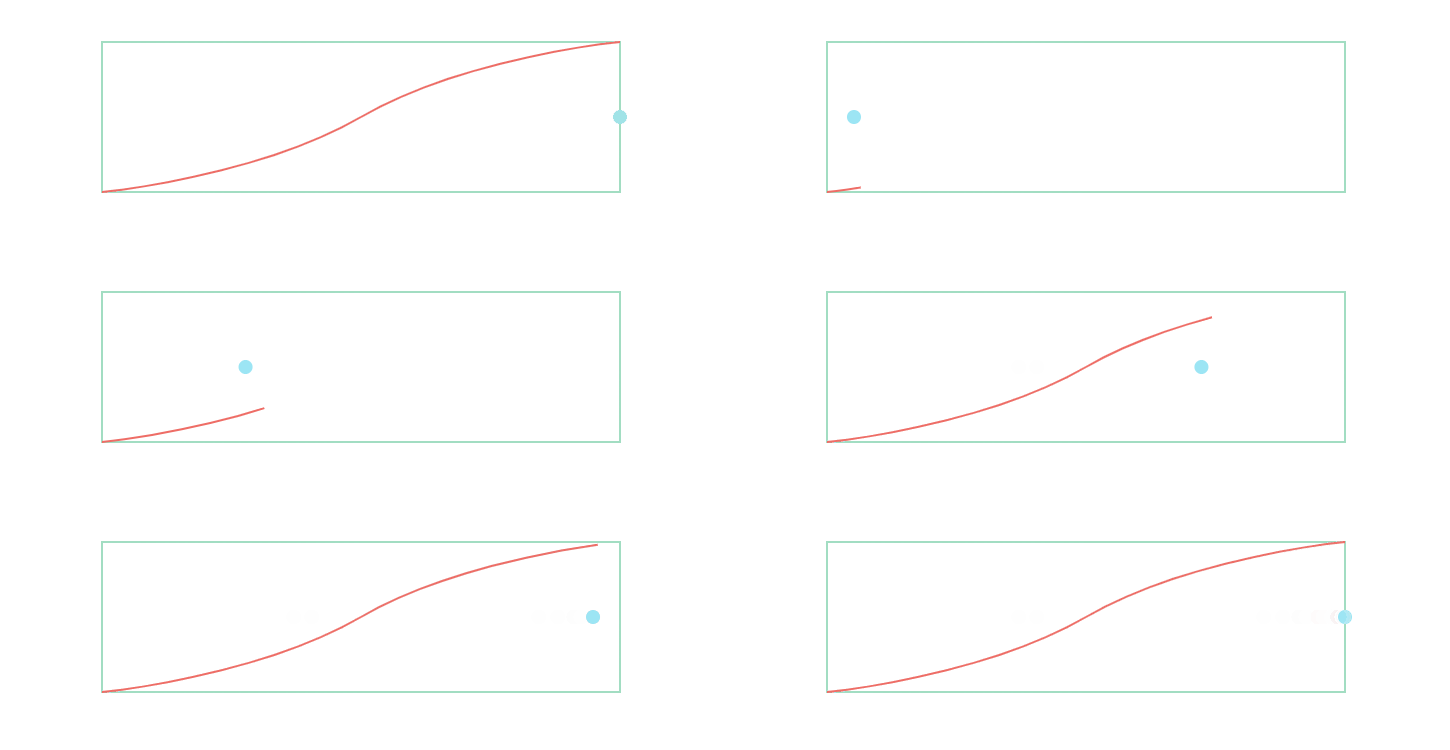
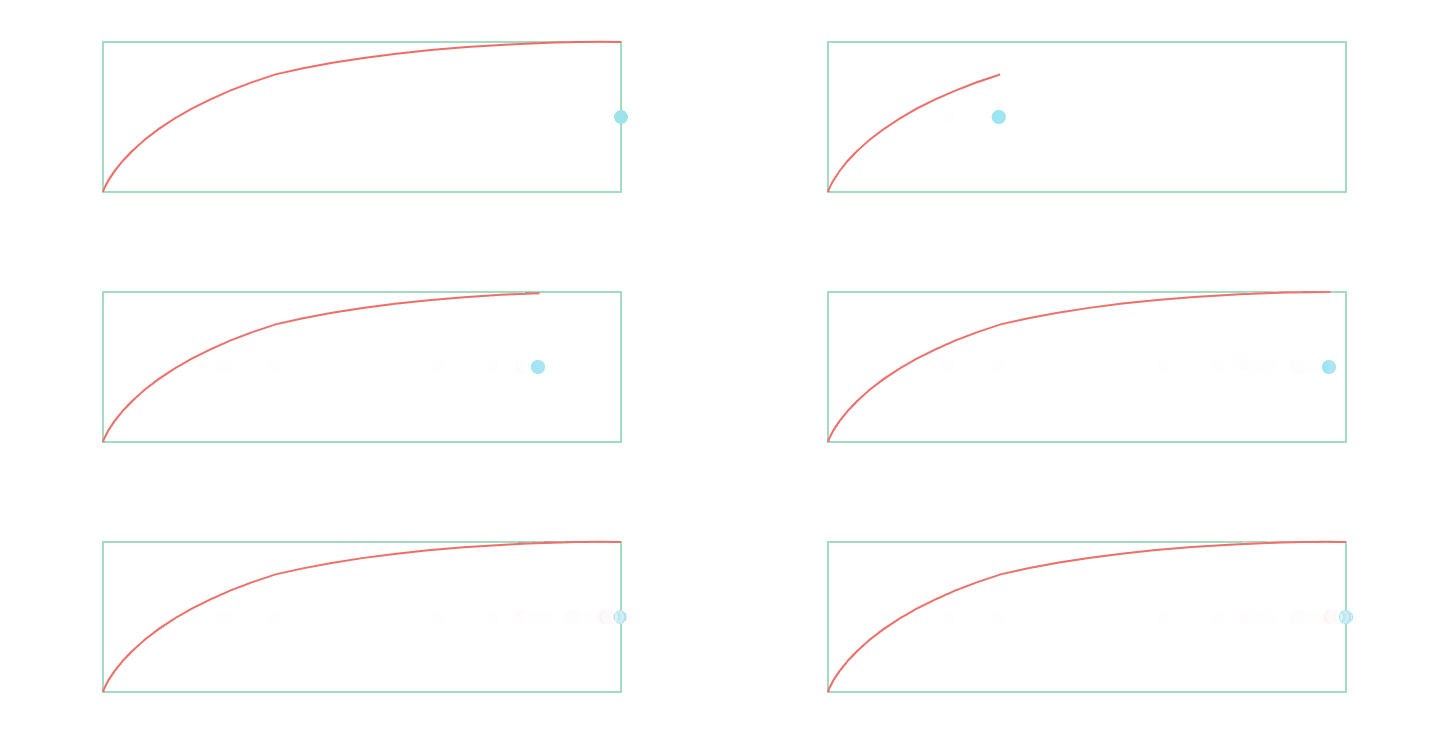
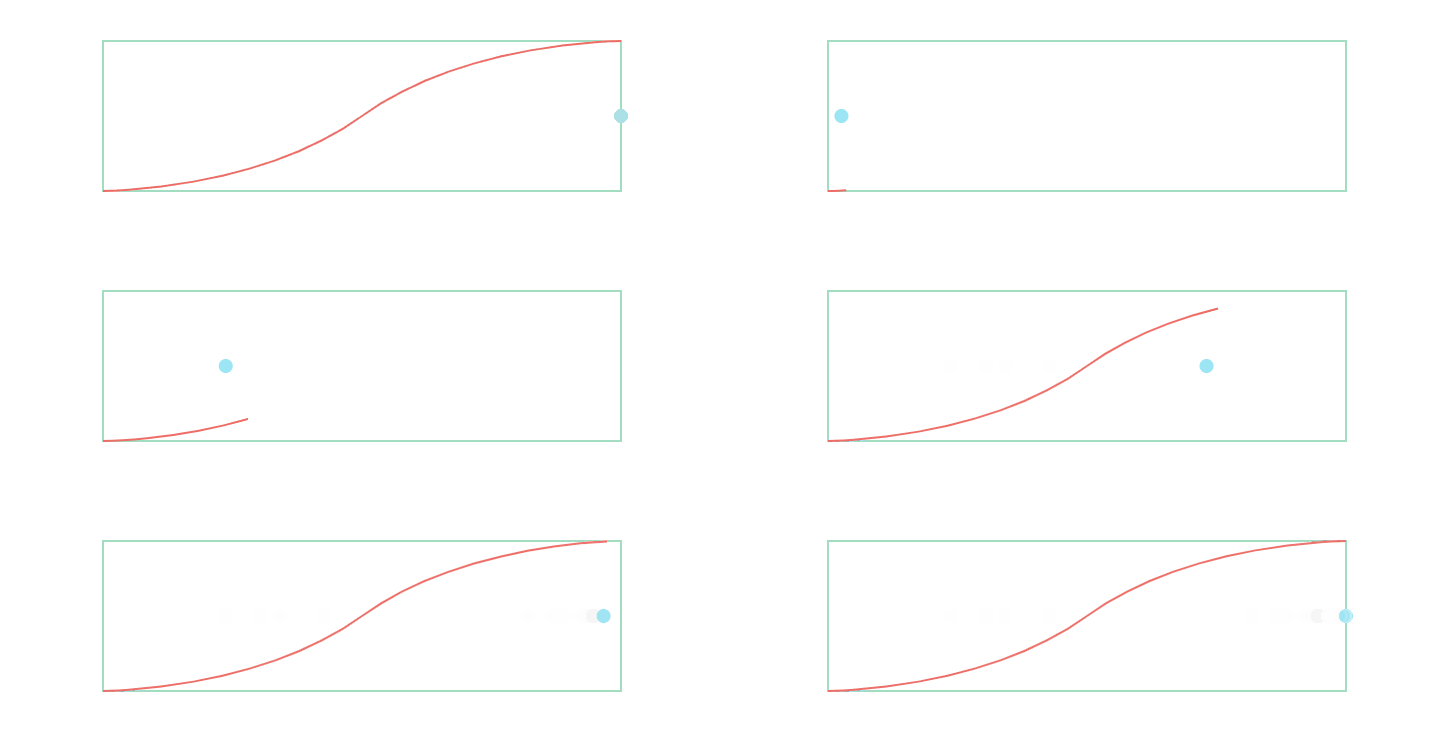
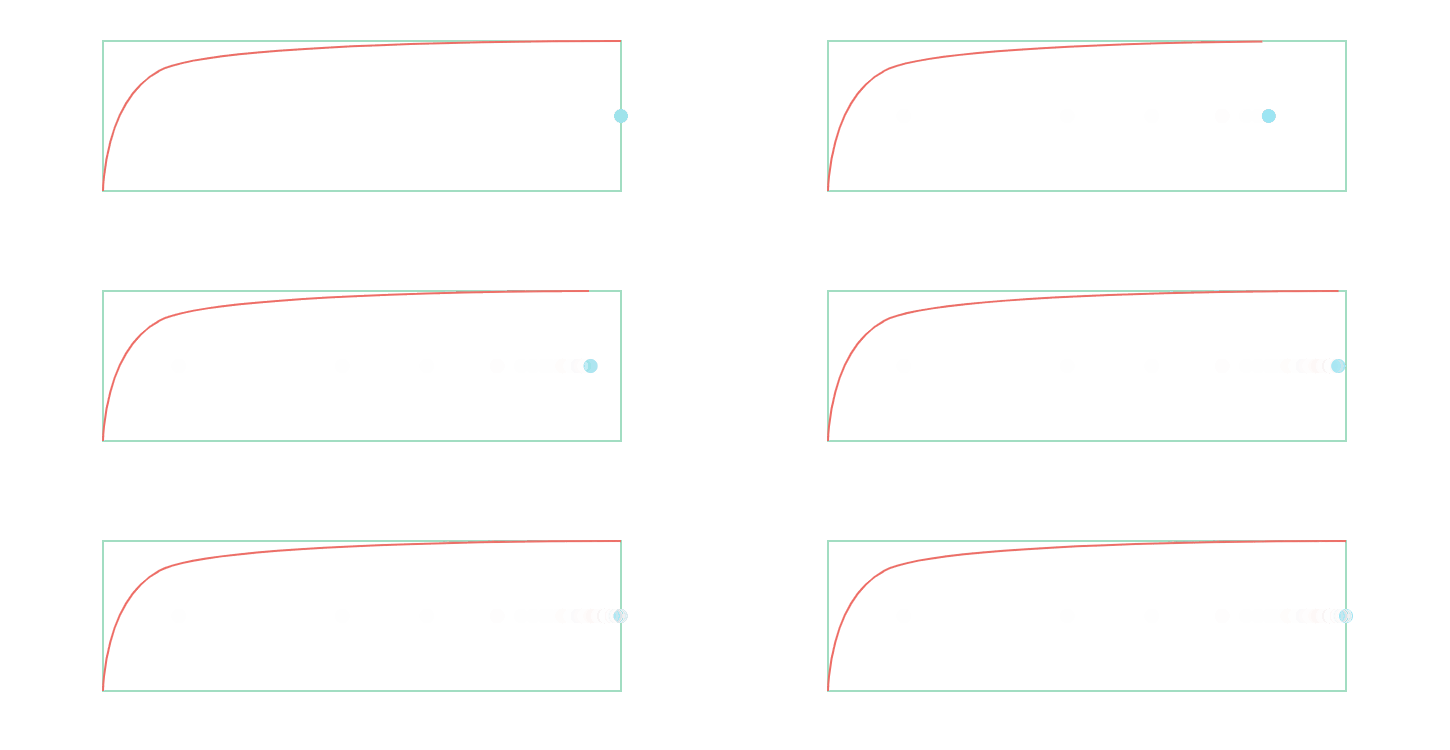
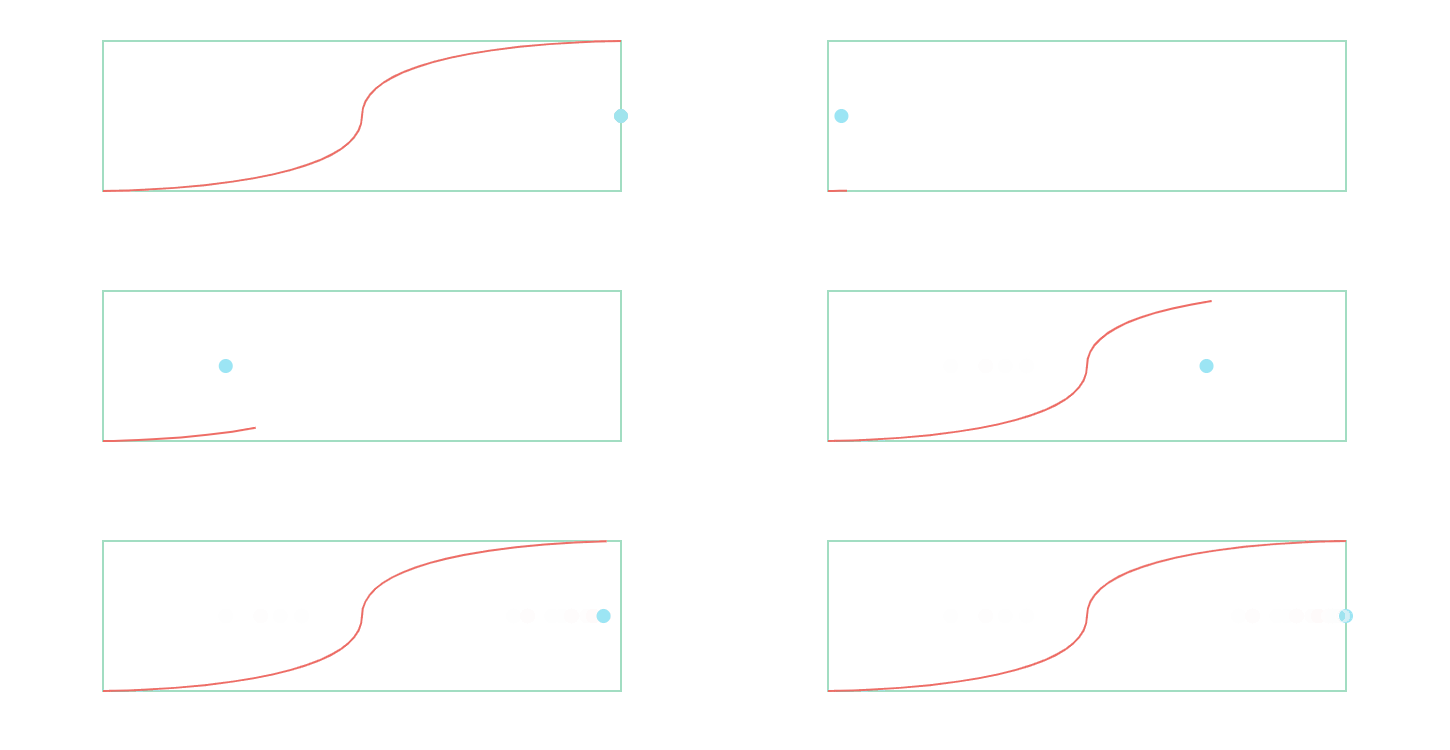
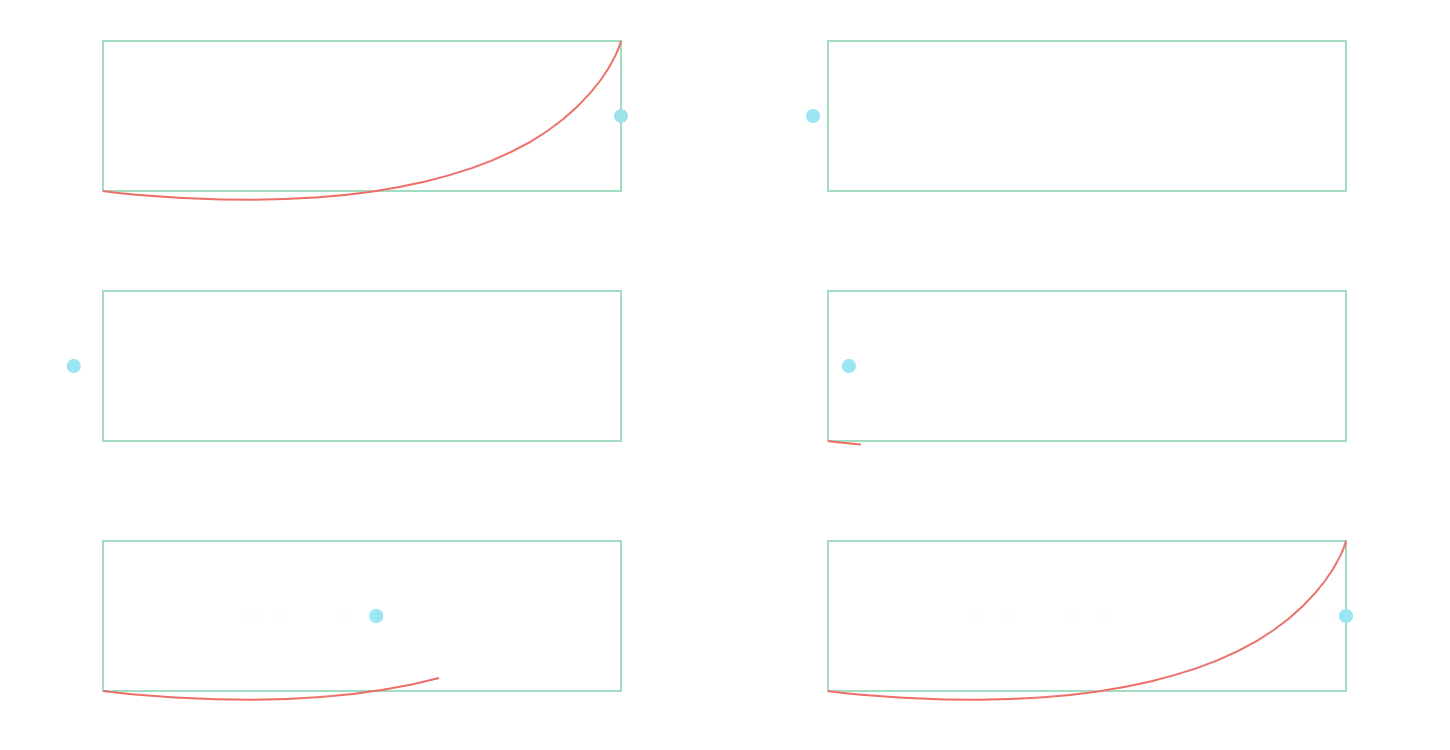
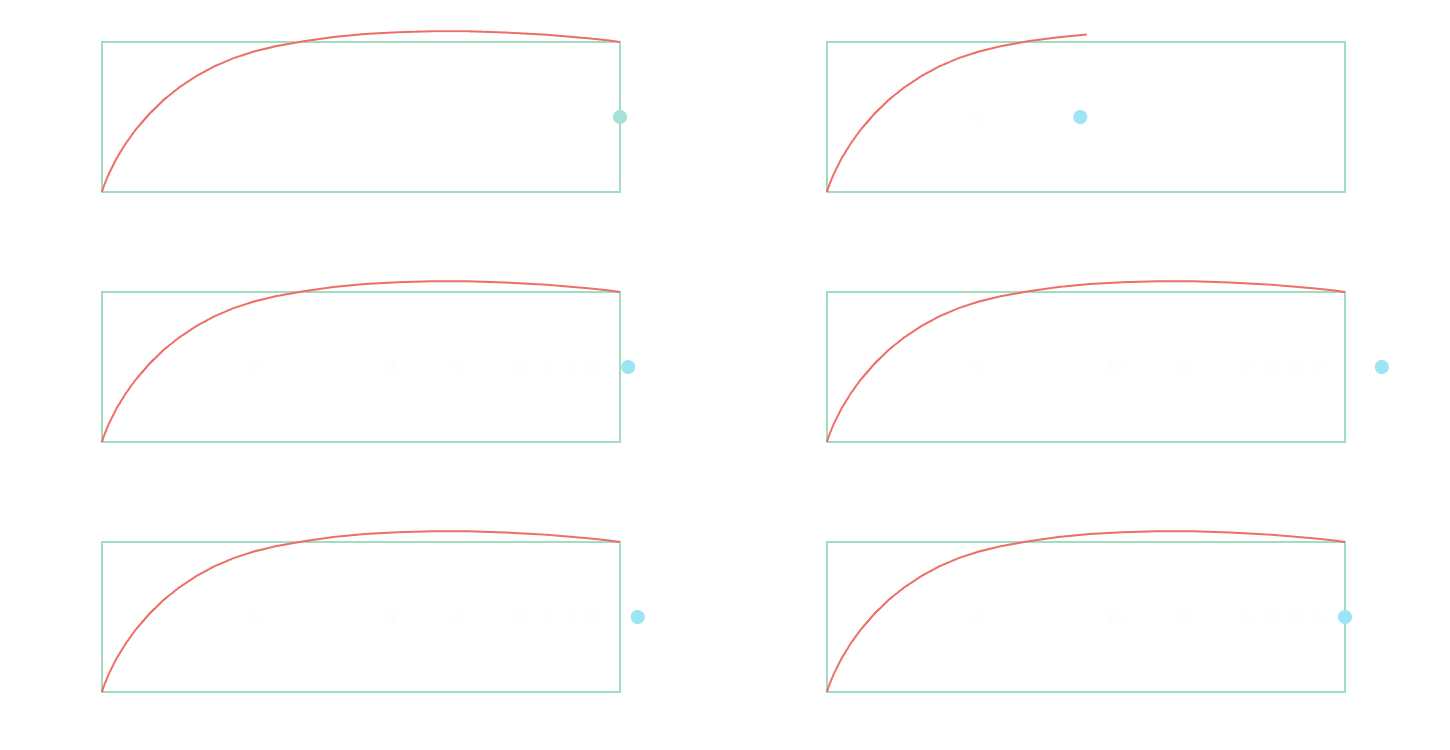
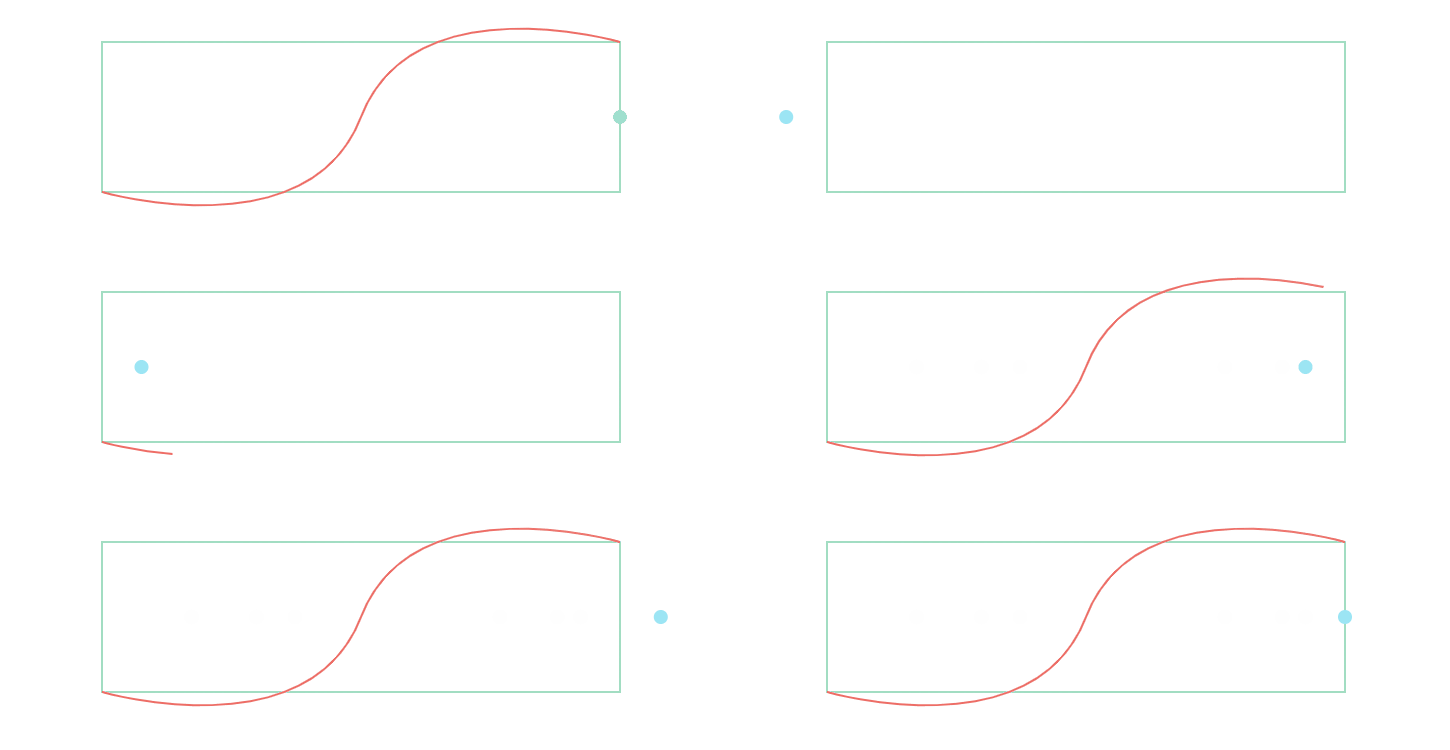
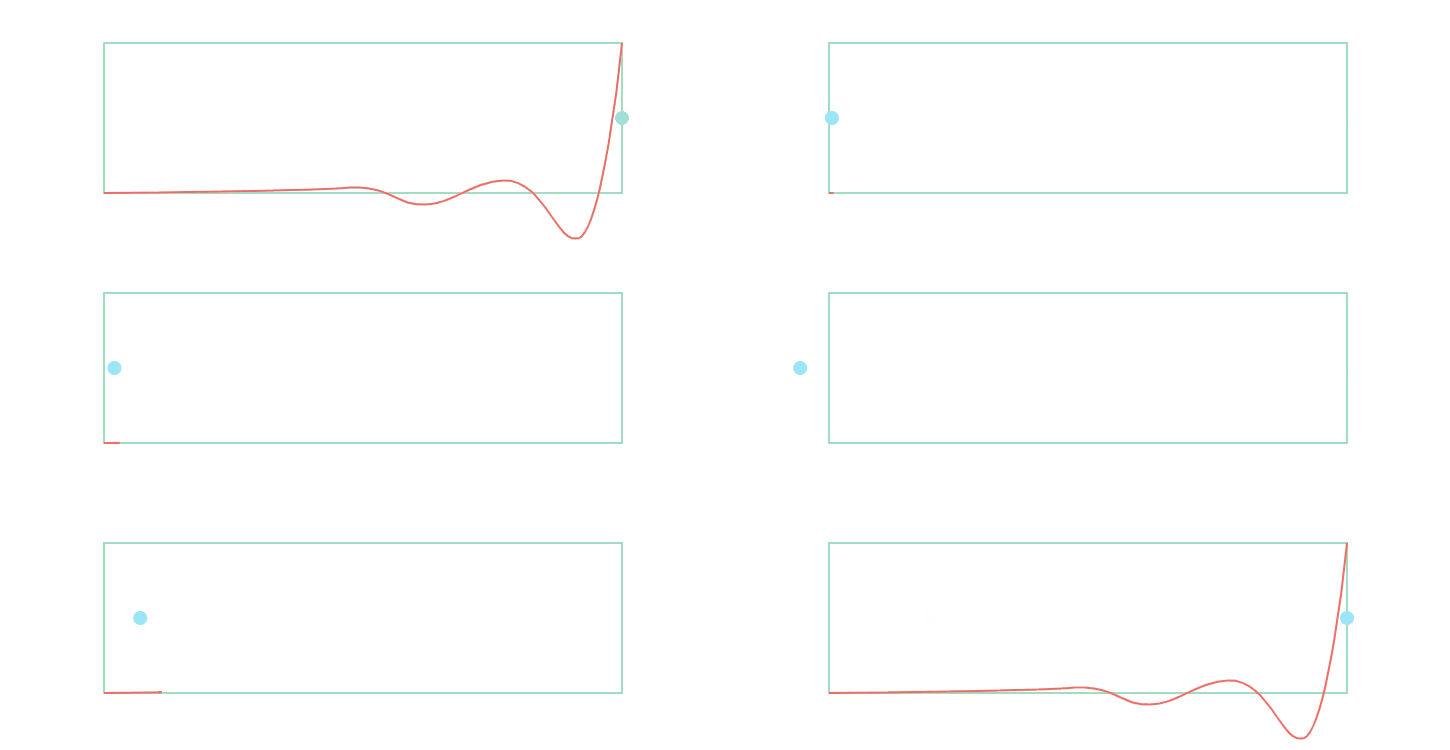
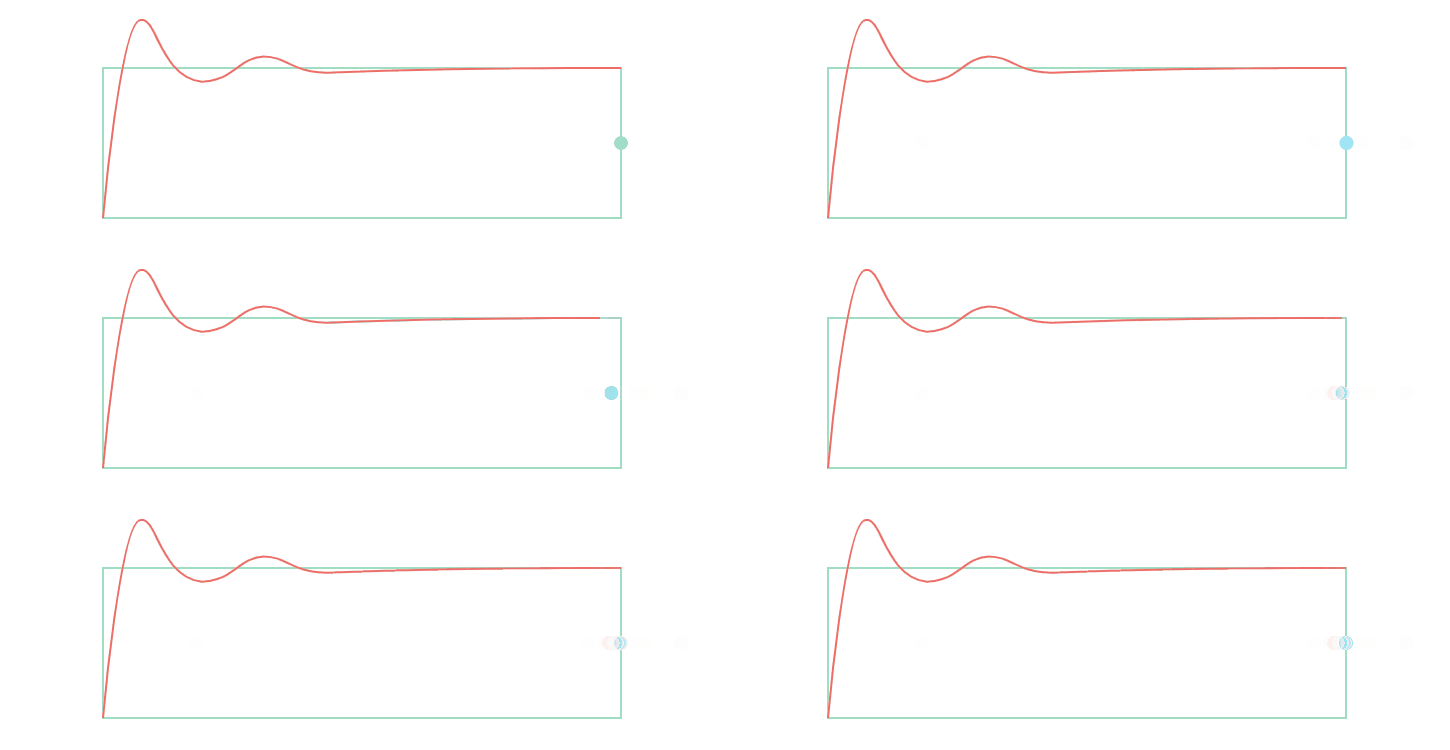
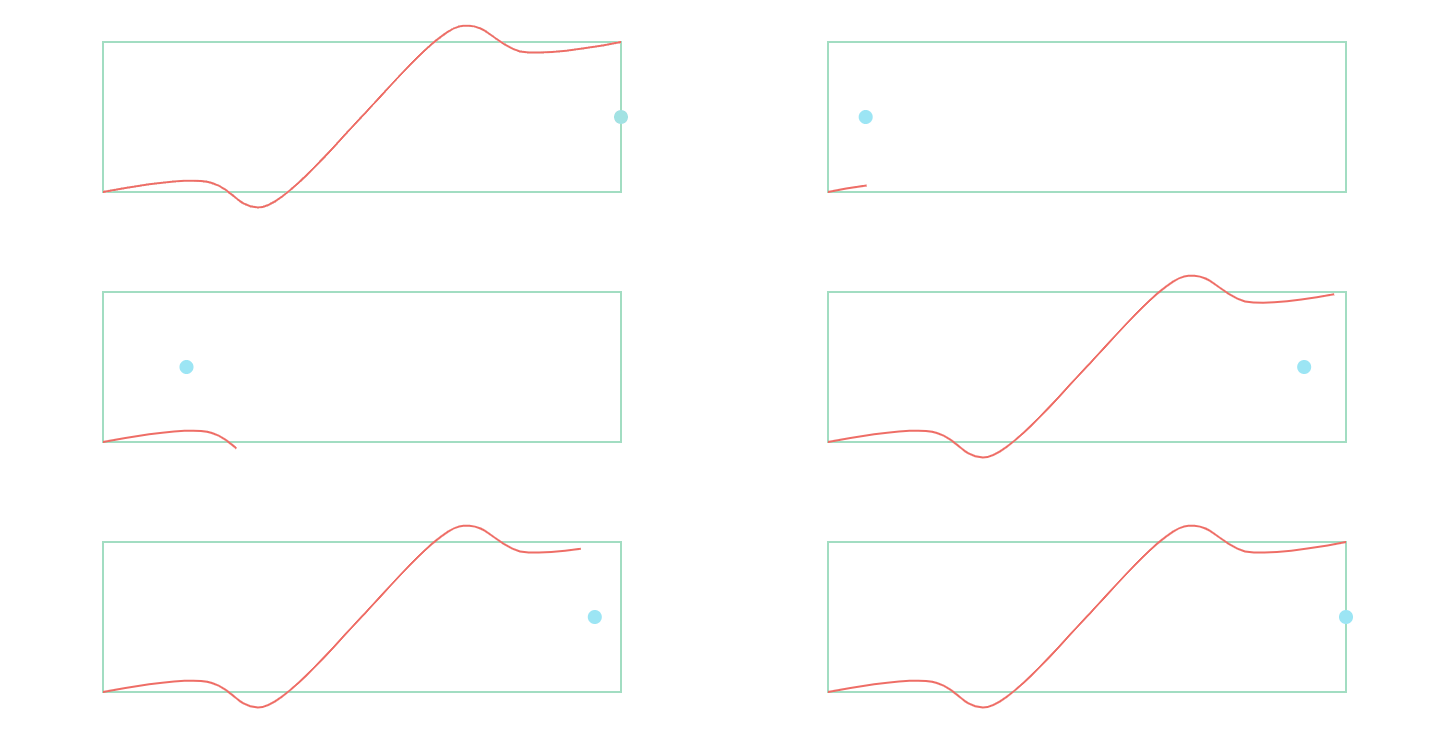
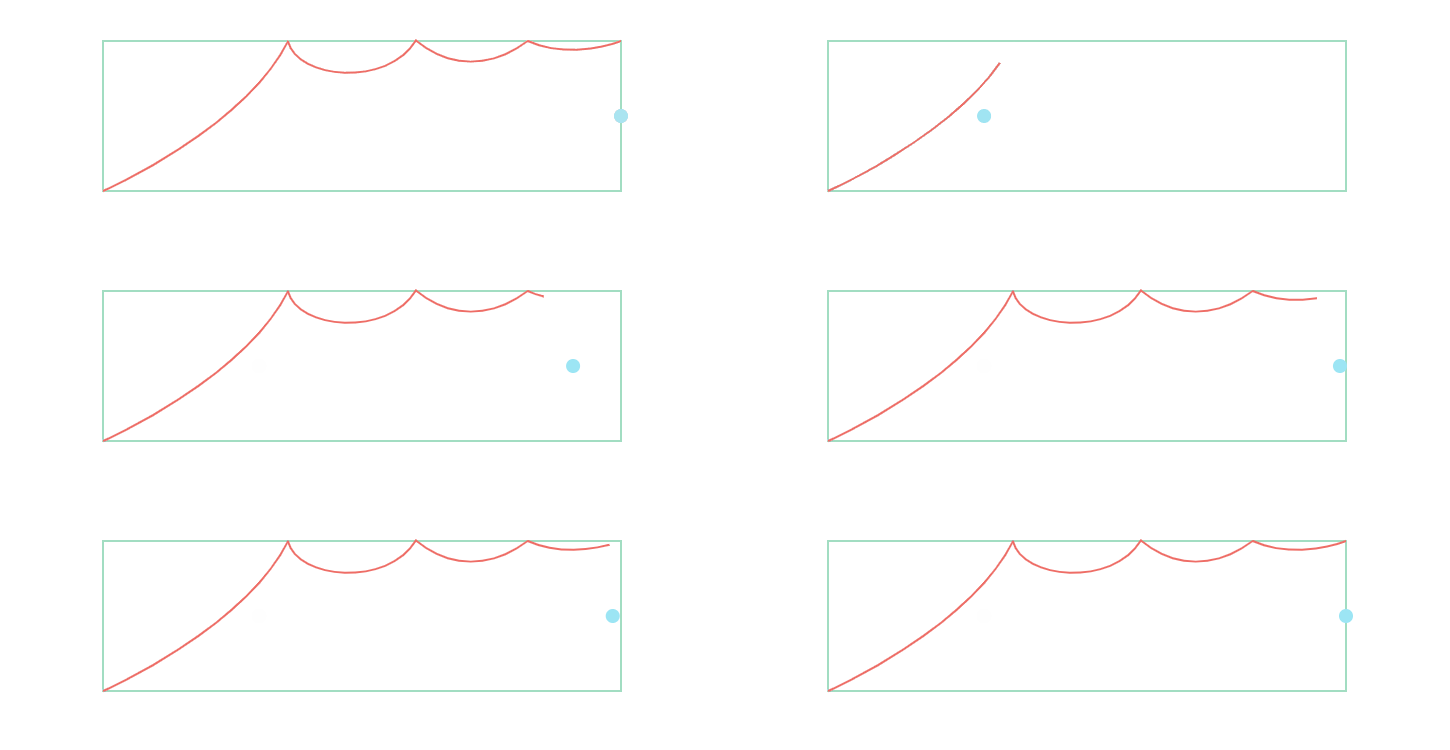
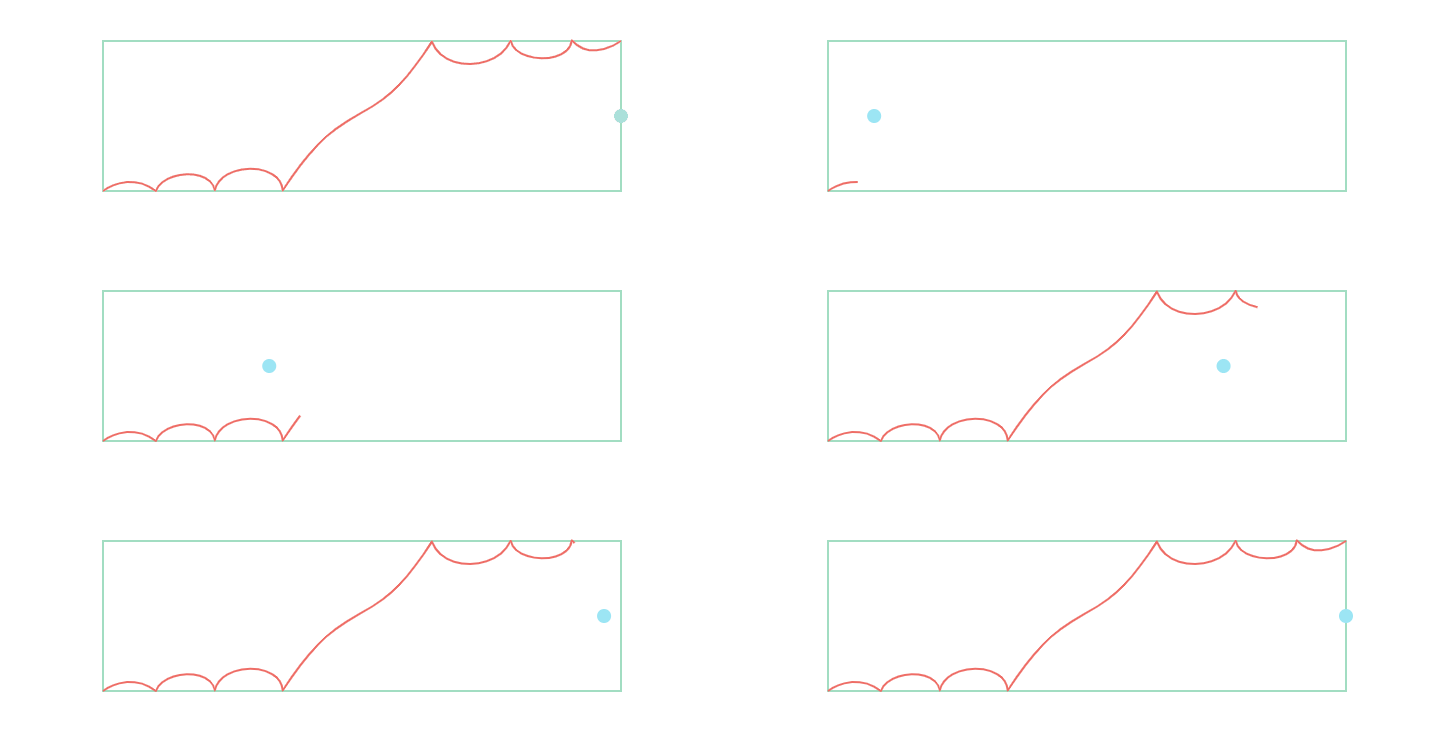
Easing Curve Table
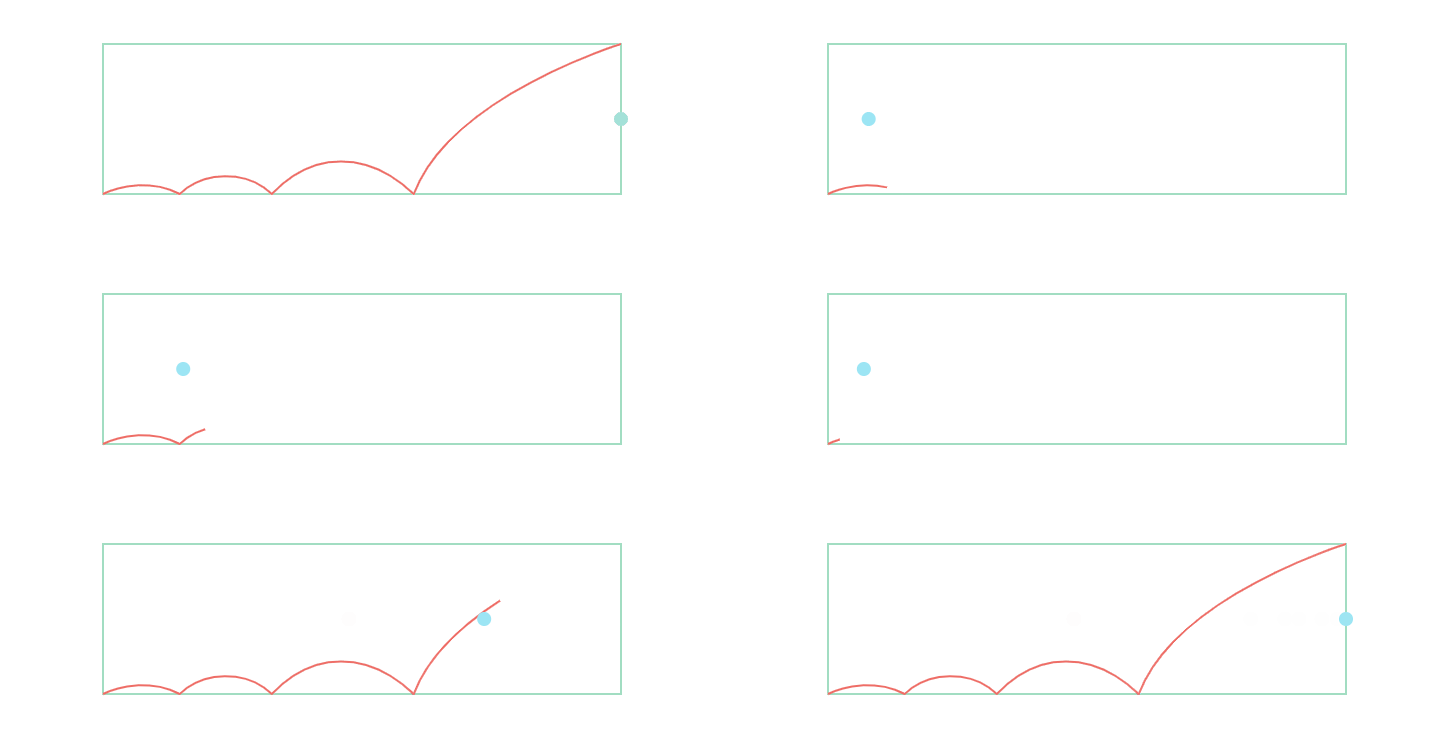
- linear
- easeInSine
- easeOutSine
- easeInOutSine
- easeInQuad
- easeOutQuad
- easeInOutQuad
- easeInCubic
- easeOutCubic
- easeInOutCubic
- easeInQuart
- easeOutQuart
- easeInOutQuart
- easeInQuint
- easeOutQuint
- easeInOutQuint
- easeInBack
- easeOutBack
- easeInOutBack
- easeInElastic
- easeOutElastic
- easeInOutElastic
- easeInBounce
- easeOutBounce
- easeInOutBounce


